What's new and improved.
Meet Beau: Bonsai's AI data assistant
Available in beta for Bonsai customers. Designed to be your platform expert, Beau answers questions specific to your business data, helps navigate reports, and provides information about Bonsai’s features.

Low-signal features now flagged in MMM results
The MMM page now makes it easier to focus on the channels that matter most. Channels with enough data signal to be robustly measured by your model are highlighted, while channels with minimal spend (less than 0.5%) are grayed out, excluded from iROI, and pinned to the bottom of the table regardless of how you sort.
This helps you zero in on actionable insights and optimize budget where it will have the greatest impact. For smaller channels that fall below the measurement threshold, you can hover over the channel and navigate directly to a matched-market test design page — a better way to measure their true incrementality.
Date, Week, Month and Year available as optional dimensions in Attribution tables
You can now add Date, Week, Month, or Year as a column in your Attribution tables — alongside all existing marketing dimensions like channel, platform, and campaign. This means you can build a view that shows a campaign's spend and attributed sales broken out by week, all within the same table.
Combined with the export functionality, this makes customized report generation significantly easier. Pull the exact breakdown you need, export it, and skip the manual reshaping you used to do after the fact.
MMM page sections are Collapsible
The Incremental/Base+/Base section of the MMM page is now collapsible. If you're reviewing results on a smaller screen, you can collapse that section to get a better view of performance by media segment without scrolling.
New default options in dropdown period selectors
Last Year, Last Quarter, Last Month, and Last Week are now available as standard options in all dropdown period selectors. No more setting custom date ranges every time you want to check performance from a previous period — just select it and go.
As always, you can compare any last-period view against the period before it to see how your business is trending over time.
CSV exports from Business Reporting
Unlock deeper insights with flexible data exports directly from Business Reporting. This feature enables you to access raw data for more advanced, customer-level analysis outside Bonsai.
Easily customize your export by selecting your desired reporting period, markets, and metrics, and choose the level of aggregation that fits your needs — daily, weekly, monthly, or quarterly.
With a single click, download a CSV file that’s ready for use in tools like Excel or Google Sheets, giving your team the flexibility to explore, analyze, and act on your data with precision.
Market Selector
Want to test a new channel, tactic, or investment strategy but not sure where to start? Market Selector makes it easy to design statistically sound matched market tests in just a few clicks.
Simply select your time period, platform, and business KPI, and the tool will automatically generate recommended matched markets based on historical performance. You can review multiple match options, compare similarity scores, and validate that your selected markets are truly comparable before launching.
By removing the manual work and guesswork typically involved in market selection, Market Selector helps you set up cleaner experiments faster. The result is more reliable test outcomes, greater confidence in your measurement, and clearer insight into the true impact of your marketing investments.
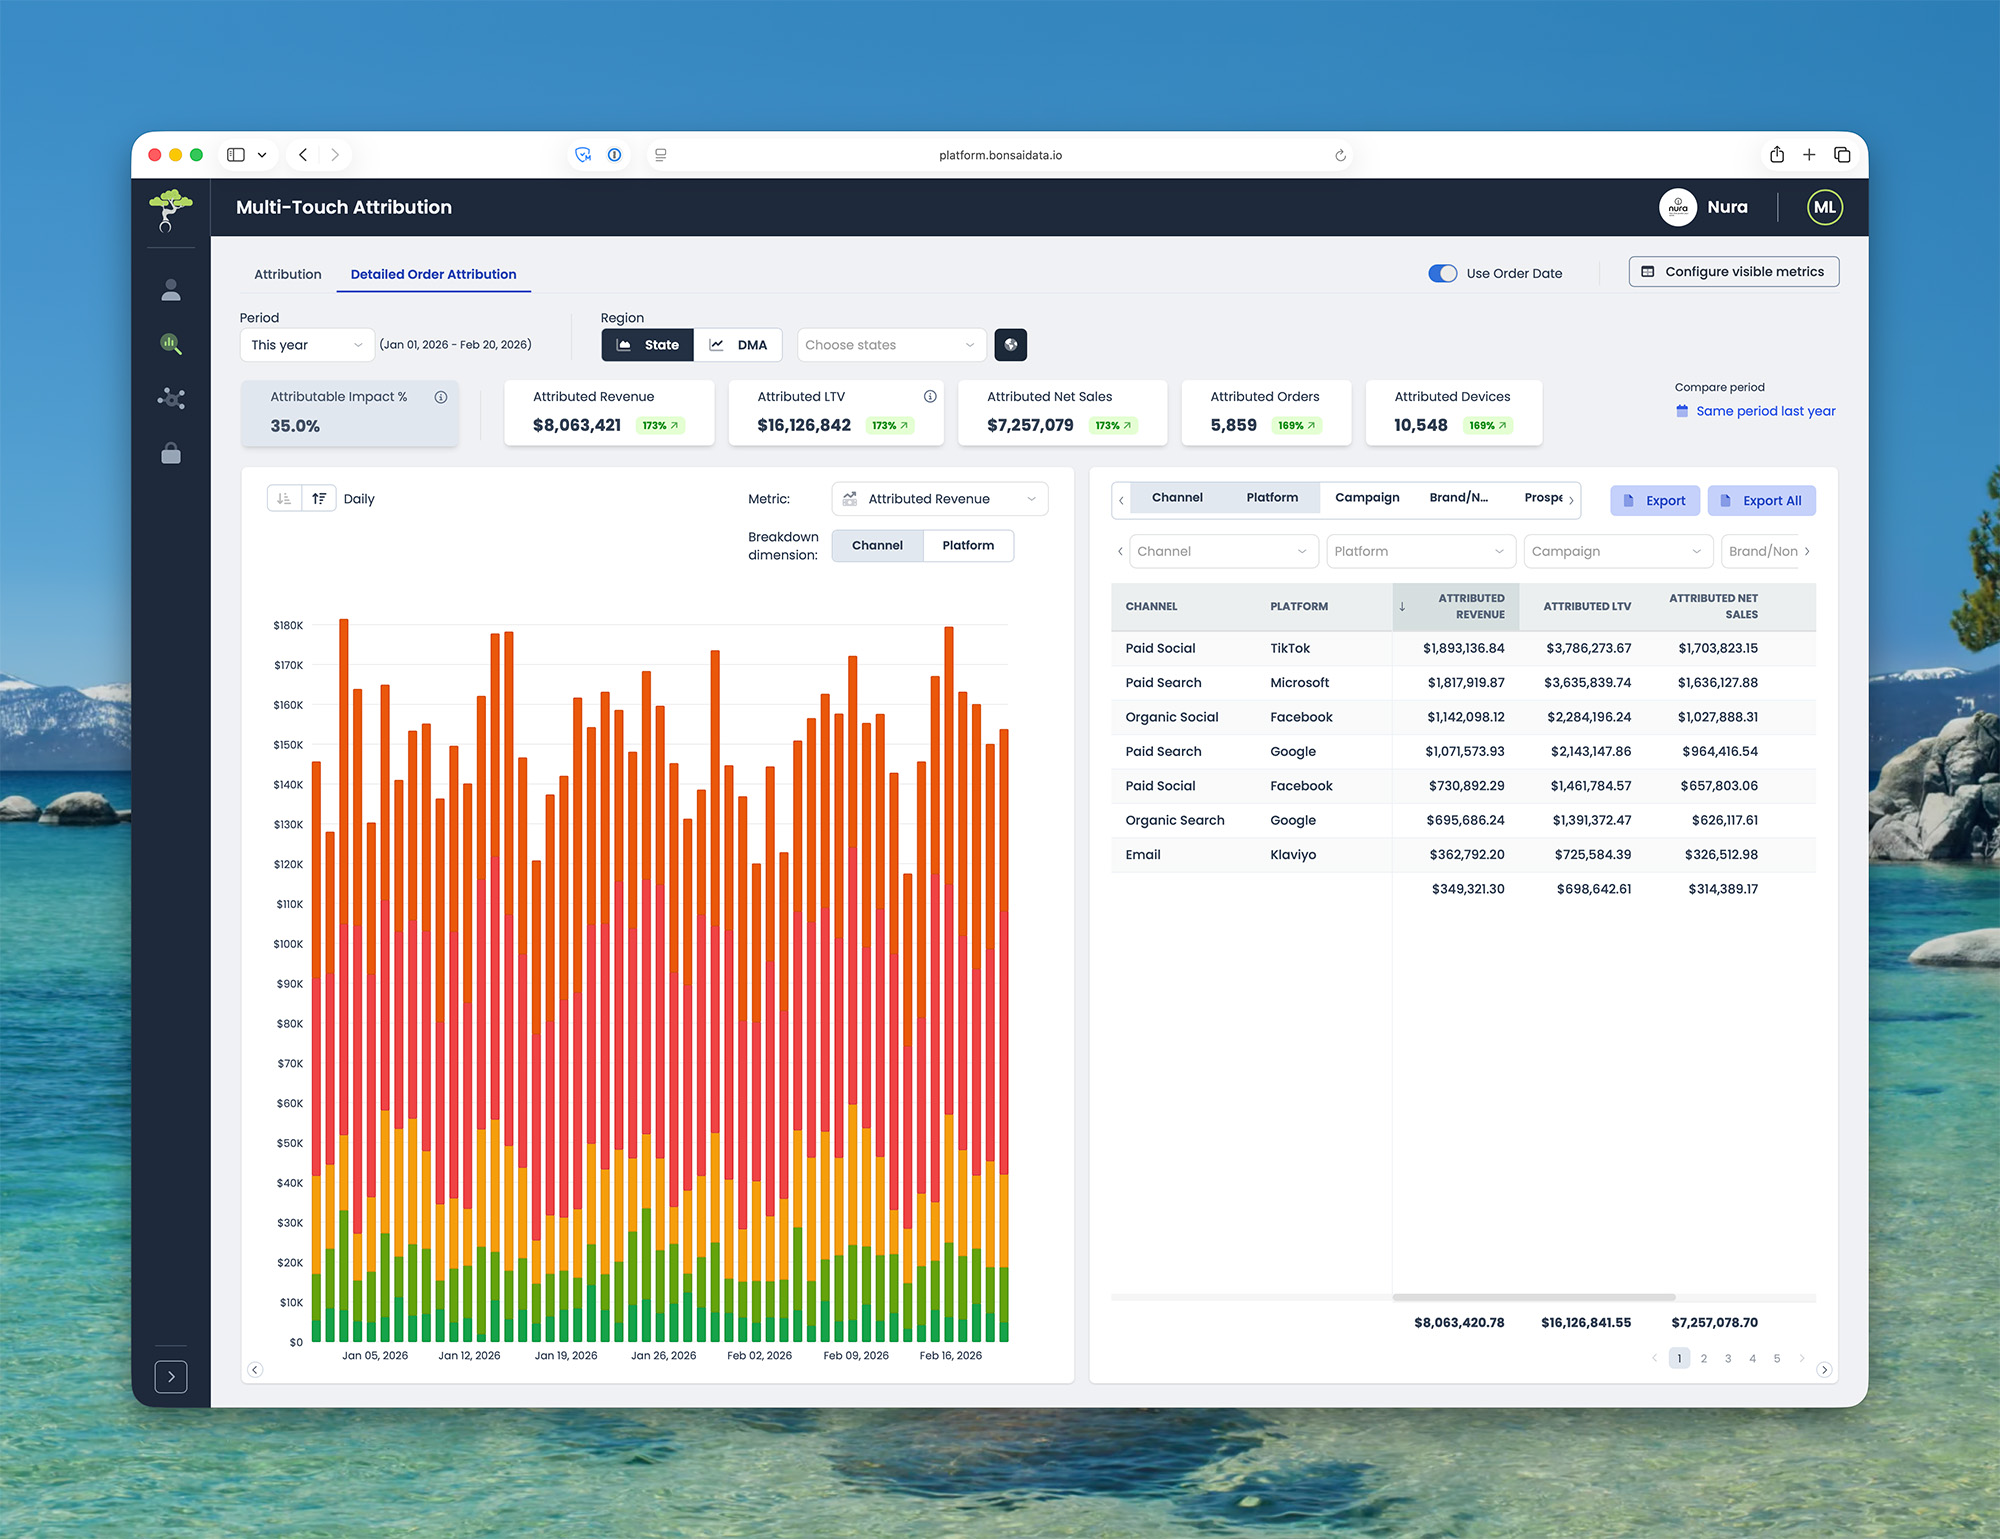
Detailed Order Attribution
You can view attribution based on when an actual sale occurred — not just when a click happened. Detailed Order Attribution lets you answer questions like which marketing channels contributed to the sales that closed in a specific reporting month.
While the main Attribution page shows results at the campaign level, Detailed Order Attribution lets you drill deeper — by landing page, creative, or any other analytics tag available in your dataset. You can see what drove leads, sales, or gross profit on a given date, and view the daily mix by channel or platform.
This feature is available inside Multi-Touch Attribution.
Marketing Mix Modeling shows most recent month of data
Marketing Mix Modeling now defaults to the most recent month with available data / results, so you see meaningful data immediately. No more confusion from empty views.
Bug fixes
Budget Planner: The “% change by feature” functionality for all available months has been fixed. This feature allows you to use a previous month’s actual budget as a baseline, and adjust spend up and down in order to hit a future month’s target and budget.
Day-of-week alignment for year-over-year comparisons
Business Reporting now supports day-of-week alignment for year-over-year comparisons. Instead of comparing a Monday this year to whatever calendar date fell a year ago — which might have been a Saturday — each day is matched to the closest corresponding day of the week from the prior year.
This gives you a more apples-to-apples view of performance, which is especially valuable for businesses with strong weekly seasonality. By aligning trends by day of week in daily view, you get a more accurate read on performance shifts, seasonal patterns, and true business momentum.
The setting is available now in Business Reporting when viewing year-over-year comparisons in daily view.
Business goal pipeline
If your finance or analytics team already maintains monthly KPI targets in a cloud warehouse or Google Sheet, you no longer need to manually duplicate them inside Bonsai. The Business Goal Pipeline connects directly to your existing data sources and pulls goal targets into your Business Reporting page automatically.
This feature creates a dynamic pipeline that syncs goals from multiple sources, so your team always measures performance against the latest targets — without maintaining them in two places. The result is better data integrity, fewer manual workflows, and a single, reliable source of truth for goal tracking.
To get started, share your goal data source with your Bonsai team and they'll configure the pipeline for you.
Business Reporting: consolidate KPI picker
The Business Reporting page is now even easier to navigate. Control which KPIs are visible (and in what order) across the entire page in one consolidated KPI picker.
You're only a click away from identifying how much business you're generated this period, how that’s trending over time, and where in the country you’re winning and losing, giving you the information you need to plan your next marketing move.
Critical Calendar Events
Critical Calendar Events allow you to annotate important business moments — like product launches, promotions, outages, or other anomalies — directly on your analytics charts. By tagging these events, teams can instantly understand why spikes or drops appear in key metrics such as spend, traffic, or orders.
This feature is designed for marketing, analytics, and growth teams who need clearer context when analyzing performance trends across reporting dashboards, MTA, MMM, Incrementality Testing, and other time-series views.
Instead of guessing what caused a performance change, teams can immediately see the business event tied to that moment in time, making analysis faster, insights clearer, and reporting far more actionable.
Algorithm Deployment Dashboard
The new Algorithm Deployment Dashboard gives you full visibility into how your predictive algorithms are running — right inside the Bonsai platform.
You can now monitor how many clicks are scored and sent into your ad platforms each day, track average click value over time, and see exactly which campaigns are bidding using the algorithm.
The dashboard also surfaces optimization recommendations, including missed opportunities from bidding constraints and suggested tROAS adjustments. Budget recommendations are coming soon.
The goal is to make the algorithm more transparent and actionable, so your team can see how incremental value is being generated and where additional scale is possible.
To get started, navigate to the Algorithm Deployment Dashboard from your Bonsai account.
Child Accounts
Child Accounts make it easy to filter your Business Reporting page by sub-group, all within your existing Bonsai account.
This feature is available to all customers and is especially useful for businesses with multiple brands, franchises, or locations. Leaders of each sub-group get easy visibility into their performance — and only their performance — removing the need to manage tens or hundreds of separate Bonsai accounts.
To get started, share a list of users and the sub-accounts they should have access to with your Bonsai team. They'll set permissions so those users can only see the child accounts assigned to them.
Improved Multi-Touch Attribution filters
You can now filter the Multi-Touch Attribution time series chart by channel, platform, campaign, and more.
Audience Segmentation: send audience lists into Meta
You can now build high-value audience segments in Bonsai and send them directly into Meta — no CSV exports, no manual uploads.
This feature is built for social and performance marketing teams running Meta campaigns. Create retargeting or suppression lists using real customer data like LTV, purchase frequency, and site behavior, then activate them in Meta with a single click. Stop relying on Meta's platform targeting and start using the data you already have.
Example audiences you can activate: high LTV customers, repeat purchasers, high-intent site visitors, and customers likely to churn.
The result is lower CPA, higher ROAS, and less wasted ad spend.
To get started, head to the Audience Segmentation page, build or select a segment, and click "Send to Meta."
Dynamic column widths
Dynamic widths are now applied to toggles and columns on Business Reporting and Attribution. No more annoying ellipses!
Bug fixes
- Budget Planner: Entering $0 of spend for a segment of your marketing now results in a forecasted output of 0, instead of the lowest non-zero forecasted value.
- Incrementality Testing: The Market Selector button now appears on both the Incrementality Testing page and the Tests page, even when you haven’t submitted any tests.
- Business Reporting: In the Performance by Market table, spend and business results that cannot be associated with a DMA are now located at the end of the table, to reduce noise.
- Search functionality on Business Reporting and Detailed Order Attribution filters is now fully functional.
Attribution: add MMM feature as a column and filter
You can now filter campaigns in the Attribution table by the MMM feature it belongs to.
Bonsai has 90+ integrations
Bonsai plugs into the tools you already use. Choose from 90+ automatic integrations to connect your ads, analytics, CRM, and point-of-sale data, then authenticate the pipeline into your cloud data warehouse in a few clicks. No need to grant external users additional access.
Inputs configuration enhancements for Shopify brands
Shopify customers can now create their own custom KPIs by grouping and categorizing all of their products and variants.

New feature! Bonsai on mobile
Bonsai is now available on mobile! No download, no app store — just open your browser and log in at platform.bonsaidata.io.
We're bringing Bonsai to mobile one product at a time, starting with Business Reporting, the page our customers check most.
Stay tuned. Mobile versions of Multi-Touch Attribution, Marketing Mix Modeling, Incrementality Testing, and more are coming soon.
Pro tip: Add Bonsai directly to your home screen
- Open platform.bonsaidata.io in your mobile browser and log in
- Tap the share icon (Safari) or the three-dot menu (Chrome)
- Tap "Add to Home Screen"
- Tap "Add"
New feature! Business Reporting filters
Filtering has been added to the Business Reporting page. Your Bonsai engineer can configure up to ten custom business dimensions based on your specifications — transaction types, store names, customer types, and much more — which will automatically show up on both Business Reporting and Detailed Order Attribution pages.

Add calculated metrics to Business Reporting page
You can now add calculated metrics to your Business Reporting page.
Bug fixes
On the Audience Segmentation page, bugs related to creating new audiences and editing existing audiences have been fixed.
Bug fixes
Charts now display properly on Safari.
See media spend charted over time
On the Incrementality Testing page, you can now see media spend charted over time in your test and holdout markets, along with each of your success metrics.
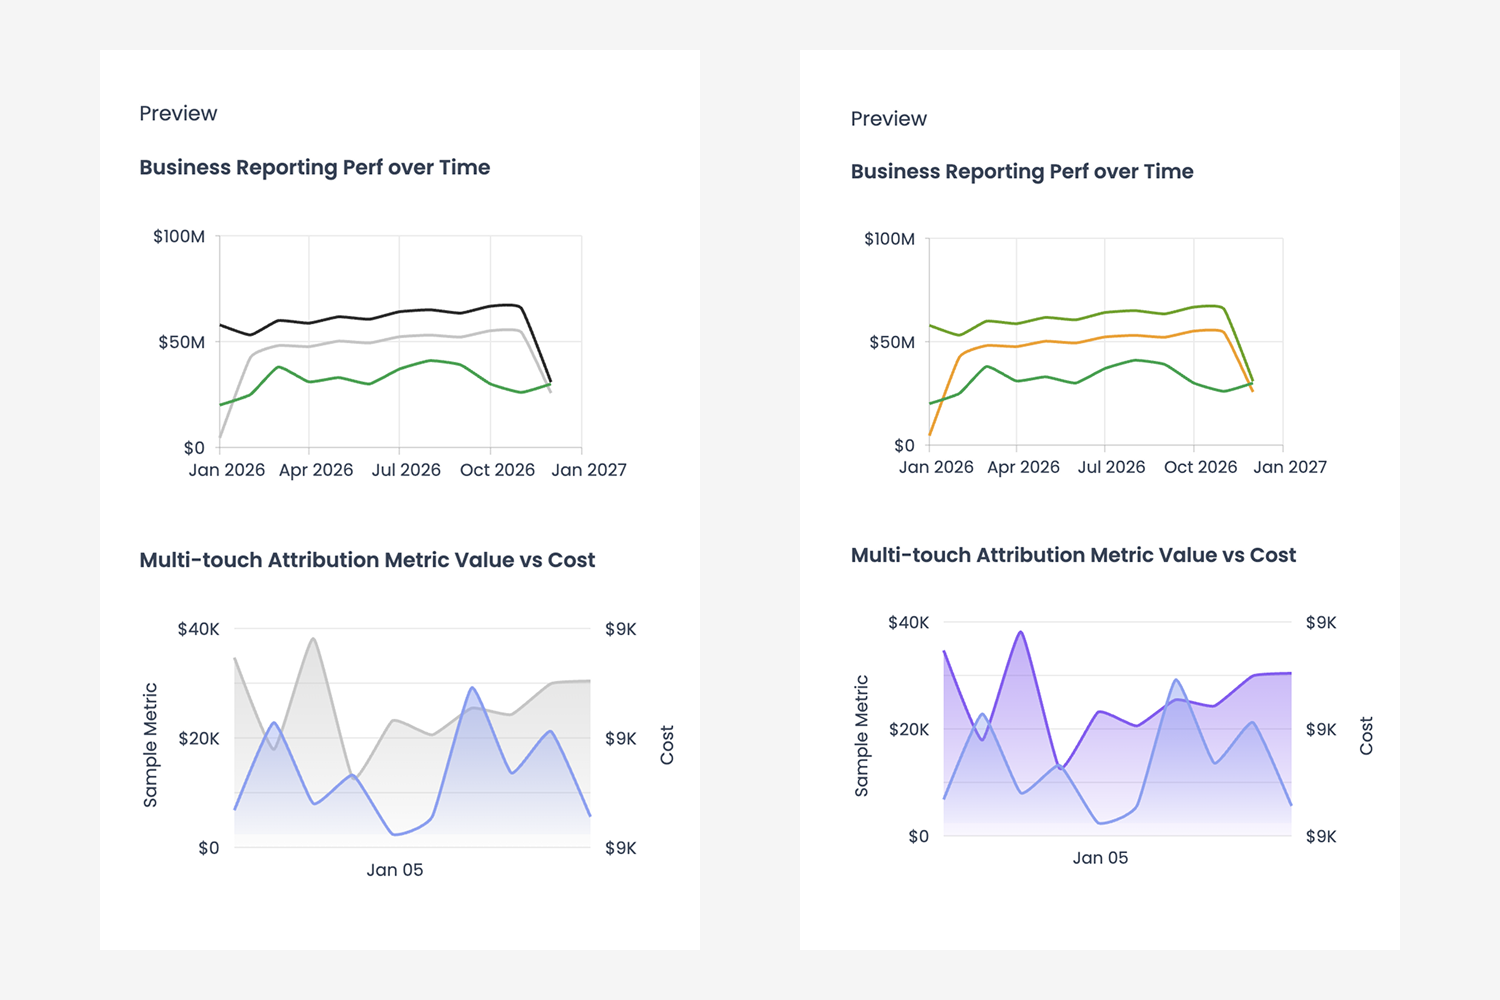
Customizable line graph colors
All line graph colors are now customizable.
New feature! Audience segmentation and send to Klaviyo
Now, you can create audience segments using more than 50 custom flags and dimensions — curated by you, configured by a Bonsai engineer — and send the list directly into Klaviyo with a click of a button.
Curious whether the campaign you created to convert this audience will actually work? Simply check the “Generate Audience A/B Test” box, and a holdout test will automatically be created and deployed for measurement.
Dynamic comparison periods and absolute change value on Business Reporting
When selecting a comparison period in Business Reporting, you can now turn on “show absolute change.”
Additional attribution drilldowns and filters
View and filter your multi-touch attribution beyond campaigns — by ad groups, creatives, landing pages, and much more.
Google Ads and GA4 account selection
Directly in the platform, identify the Google Ads accounts and GA4 properties to include in your measurement. Update at any time.
18 new one-click platform integrations
You can now add integrations such as Quickbooks, Amazon DSP, Stripe, Intercom, Facebook and LinkedIn pages, and more.
Order-level attribution
See how last month’s, last week’s, or yesterday’s orders were attributed to marketing channels, filter marketing attribution by up to 10 custom business dimensions, and see how attribution changes over time.
Business reporting by DMA
See and compare spend and business performance by market.
Identify best and worst performing markets by spend, return, and ROI.
Facebook Algorithm
The bidding algorithm that drives 30%+ incremental growth is now available for use on Meta.
No more wasted Facebook dollars on conversions that aren’t incremental. Your Facebook Ads custom algorithm allows you to buy incremental impact directly through the Facebook Conversions API. This significantly improves Facebook Ads efficiency and increases its incremental impact.
Budget Planner
With Budget Planner, you can build next month’s budget with confidence.
Get a “maximum profit” budget recommendation, then make adjustments and instantly see the new forecasted business outcomes and profit with each change you make, until you hit your target with your available budget.